Exploring CUDA, Threading and Async Python - Part 2
In my previous blog post, we discussed pre-processing, particularly through multithreading. Now, let’s try to understand what it means to put the GPU under pressure. First, we'll focus on "native" PyTorch. We might dive into model-level optimizations later (and what that means for execution).
CUDA
CUDA is a parallel computing platform and programming model developed by NVIDIA, for NVIDIA GPUs (breaking news). Basically, it allows developers to harness the massive computing power of NVIDIA GPUs for tasks far beyond just graphics rendering. While CPUs (processors) are optimized for handling sequential tasks, GPUs are built for parallelism and can process thousands of operations simultaneously.
A good analogy would be to compare the CPU to a sports car and the GPU to a truck. Imagine you need to move from point A to point B. The sports car (CPU) would get there very quickly, but it would take several trips to transport all your boxes because its trunk is small. On the other hand, the truck can haul everything in one go, even though it's slower than the sports car. In the end, the truck will get the job done much faster. So, while the CPU is great for small tasks with low latency, the GPU excels at handling heavy workloads (even though it can take a little longer to get started).
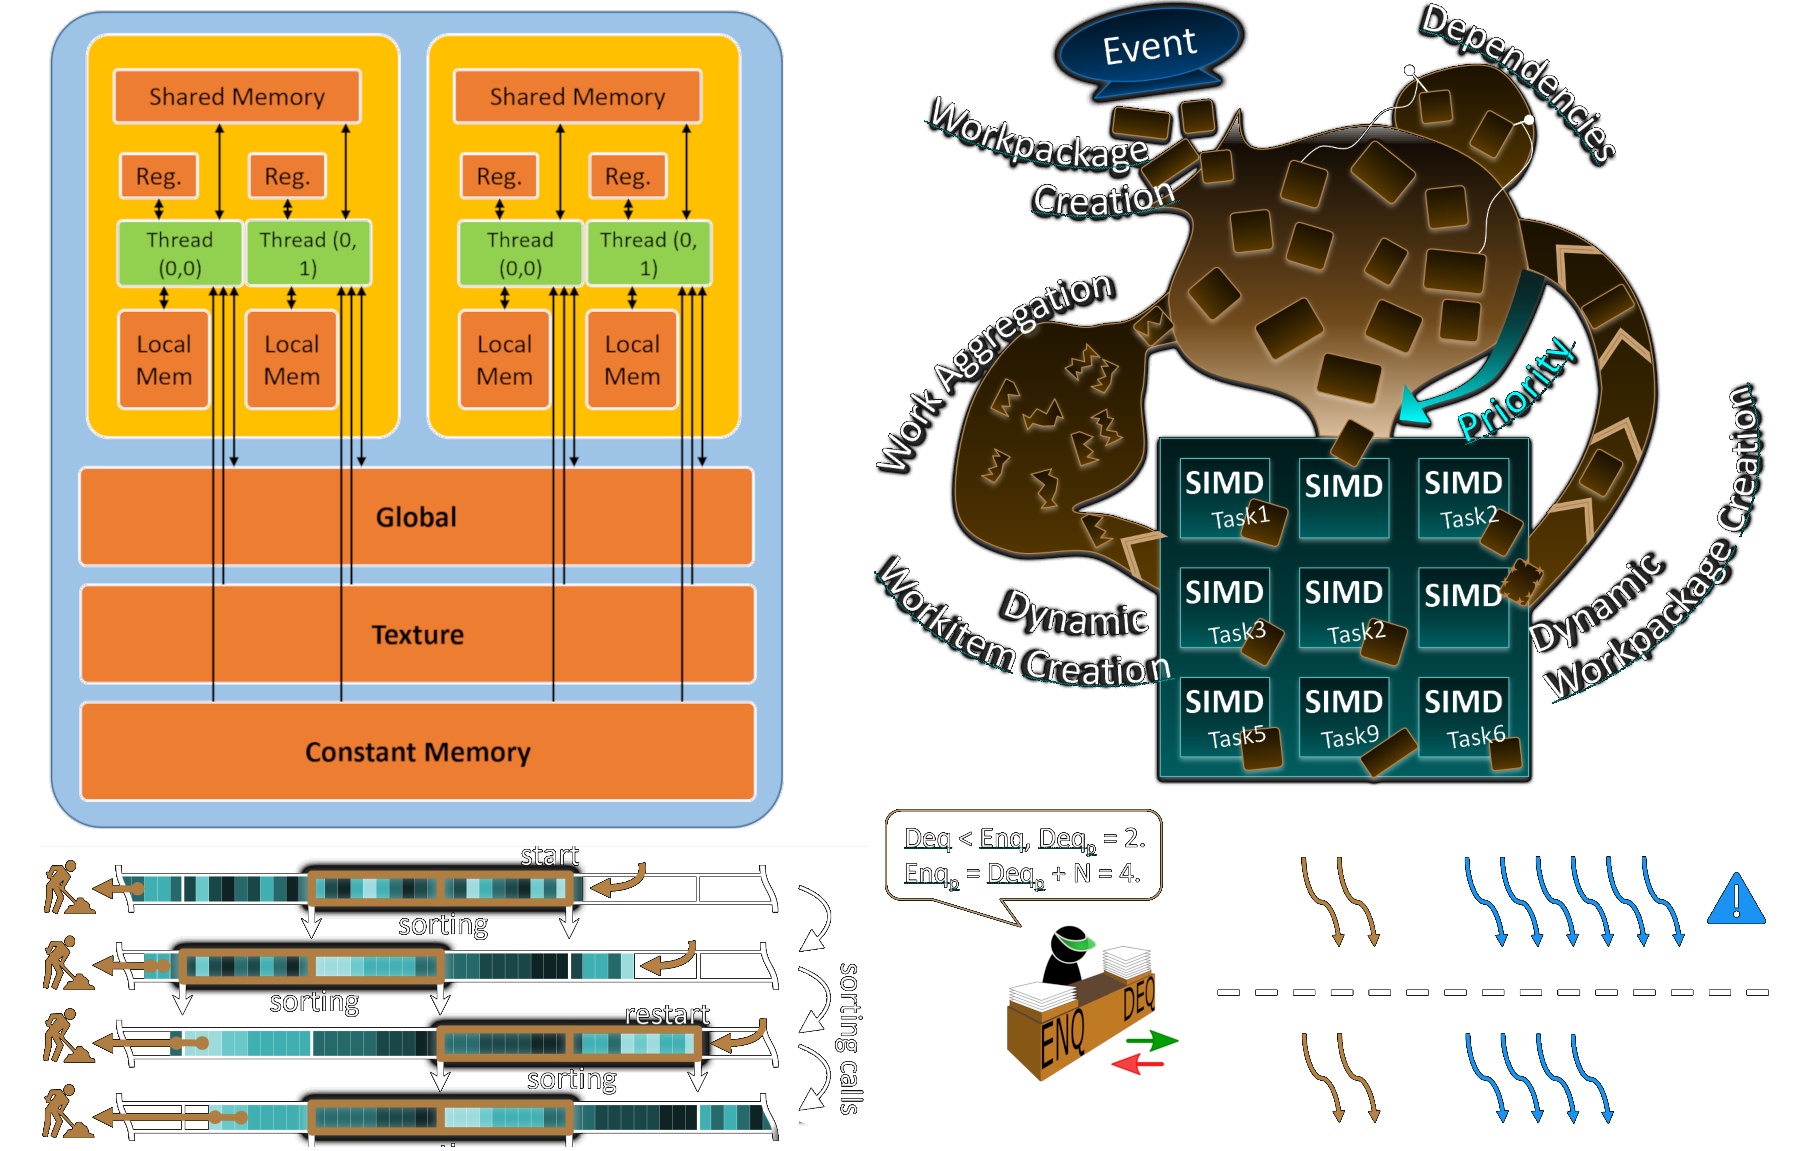
When programming with CUDA, the CPU and GPU work together. The CPU, often called the host, takes care of things like memory management, data transfers, and launching CUDA kernels (functions that run on the GPU). The GPU, known as the device, steps in whenever heavy-duty parallel computations are needed.
This division of labor allows the CPU to focus on overall logic while the GPU handles the heavy, parallel operations, optimizing the performance of our AI models (or any other computing tasks, really).
If you want to dive deeper into CUDA programming, I can only recommend the following resources.


Under Pressure
To simplify the problem and highlight how the GPU works, we’ll generate the data directly on the GPU. This way, we’ll only focus on the computation phase (since data transfer can be a bit tricky). We’ll use a ResNet18 model (with a softmax at the output). The model is deliberately not very large, so we can identify when the CPU starts lagging behind.
Since the model runs very quickly, the GPU will finish its job fast, meaning the CPU needs to send instructions rapidly if it wants the GPU to work at full capacity. All calculations will be done on the GPU, with the CPU’s sole task being to provide instructions to the GPU. Here is the script I wrote to execute this small benchmark.

The benchmarks were run on my setup (RTX 3080 Ti and i7-12700KF backed with DDR5). For comparison, I also ran the code on CPU. Since the code uses only a single process, I expect batch size to have very little influence on performance for the CPU, as it's designed for sequential operations. However, the impact will likely be much more noticeable when running on the GPU. Since the model isn’t computationally heavy, the GPU may be underutilized with smaller batch sizes, as the CPU won't be able to send instructions fast enough to keep the GPU busy. Below is a nice graph of my results.
As expected, the results align with our assumptions. The number of FPS appears independent of batch size when computations are done on the CPU, stabilizing around 120 FPS. However, on the GPU, batch size does have a noticeable impact. Performance improves as the batch size increases, until it eventually hits a plateau around 5000 FPS. This likely means that the GPU is then running at full capacity. Remember that we didn't apply any optimization yet.
NVIDIA Nsight Systems
Now that we've seen some raw results, it could be interesting to dive deeper and understand what’s really happening between the CPU and the GPU. To help with this, NVIDIA provides us with a dedicated tool: Nsight Systems.
The following graphs were generated using NVIDIA Nsight Systems 2024.2. I had to generate them from Windows (yeah, I know, but it's convenient for gaming) because I couldn't get the tool to work properly in WSL2 (GPU traces were missing), even though it’s supposed to be supported since version 2024.2. If anyone has a solution, I'm all ears. Anyway, enough digression.
I ran multiple profiling sessions for different batch sizes (on the GPU, of course). This seems to confirm our earlier assumptions. For smaller batches, the CPU struggles to keep up. Instructions are sent to the GPU and executed immediately, resulting in low GPU utilization. Most of the GPU activity is composed of kernels (i.e. computations), but that doesn’t necessarily mean the compute units are fully saturated. The low memory usage corresponds to loading the model onto the GPU at the start of the program.
As the batch sizes increase, the GPU takes more time to process the data (around a 225ms delay, as seen in the graph below). This gives the CPU enough time to prepare the next set of instructions and send them to the GPU. At this point, the GPU is (nearly) fully utilized.
Of course, it’s not possible to increase the batch size indefinitely. We're limited by the available vRAM (12 GiB in my case), which allows for a maximum batch size of 1024 images for this model.
Conclusion
We've seen how to theoretically saturate the GPU. That said, several optimizations can still be made to improve performance (quantization, kernel fusion, etc.). One key aspect not to overlook is data transfer between the CPU and GPU. We’ll likely dive into that next time.


