
Exploring CUDA, Threading and Async Python - Part 1
I've been working with Python for quite some time now. When it comes to AI application development, I particularly enjoy using PyTorch. This has given me the opportunity to tinker a bit with CUDA. As models continue to grow in size, optimizing compute resources becomes critical, both for training and inference. Given the cost of GPUs (👋 NVIDIA), it’s essential to make the most out of the hardware. Put simply: the GPU needs to be running at full throttle. All the time. In my experience, that’s easier said than done. The Python x CUDA combo can often be a real headache when it comes to maximizing performance. Not that it's impossible, but it's definitely not straightforward.
In this series of posts (if I don’t get too lazy to finish it), I'll dive into using threading with Python, its integration with CUDA, and how to work with asynchronous code.
Introduction
Before diving into the mysterious (and mostly convoluted) world of CUDA, we need to go back to basics about AI model execution.
To start, one might wonder why we even need a GPU. I won’t dwell too much on the topic, but the answer is pretty simple: tons of matrix multiplications + massive parallelization, so GPU.
Generally speaking, executing an AI model often follows the same steps. Here, I’ll focus on inference, but it's pretty similar for training.
- Data loading (CPU)
- Pre-processing (CPU)
- Computation (GPU)
- Decoding (GPU or CPU)
- Response (CPU)
For example, in the case of an image classification model, we would start by loading an image, resizing it, running the model, and applying a softmax to convert the model's output into a probability distribution. Finally, we might convert the class ID into something more understandable for us, mere humans.
Often, we perform calculations in batches. Since the CPU is optimized for low latency and sequential operations, while the GPU excels with high throughput and parallel calculations, it’s more effective to send batches of data to the GPU. Again, I won’t go into further detail here, as it's a bit outside the scope of this article.
Handling data
Before we dive into model execution itself, we need to focus on data loading and pre-processing.
Managing data loading is fairly straightforward. Typically, you'll read the data from a disk or over the network (for instance, from a web API). The computational cost is quite low, and the CPU spends most of its time waiting (because disks or network are soooo sloooow). For this task, using threads or coroutines (like asyncio, trio, etc.) works very well.
In this series of articles, I’ve used images from the Lorem Piscum service (didn't know the service before, loved it). If you want to know more about concurrency and coroutines, here are few articles that I like.
 Brad Solomon
 Andy Balaam
 Jim Anderson
As well as a little bonus on generators.
Here's the script I used to download a set of images for my experiments. You can also find it (along with the requirements) in my cudasync repository. I know, I got very inspired when choosing the name.

Threading
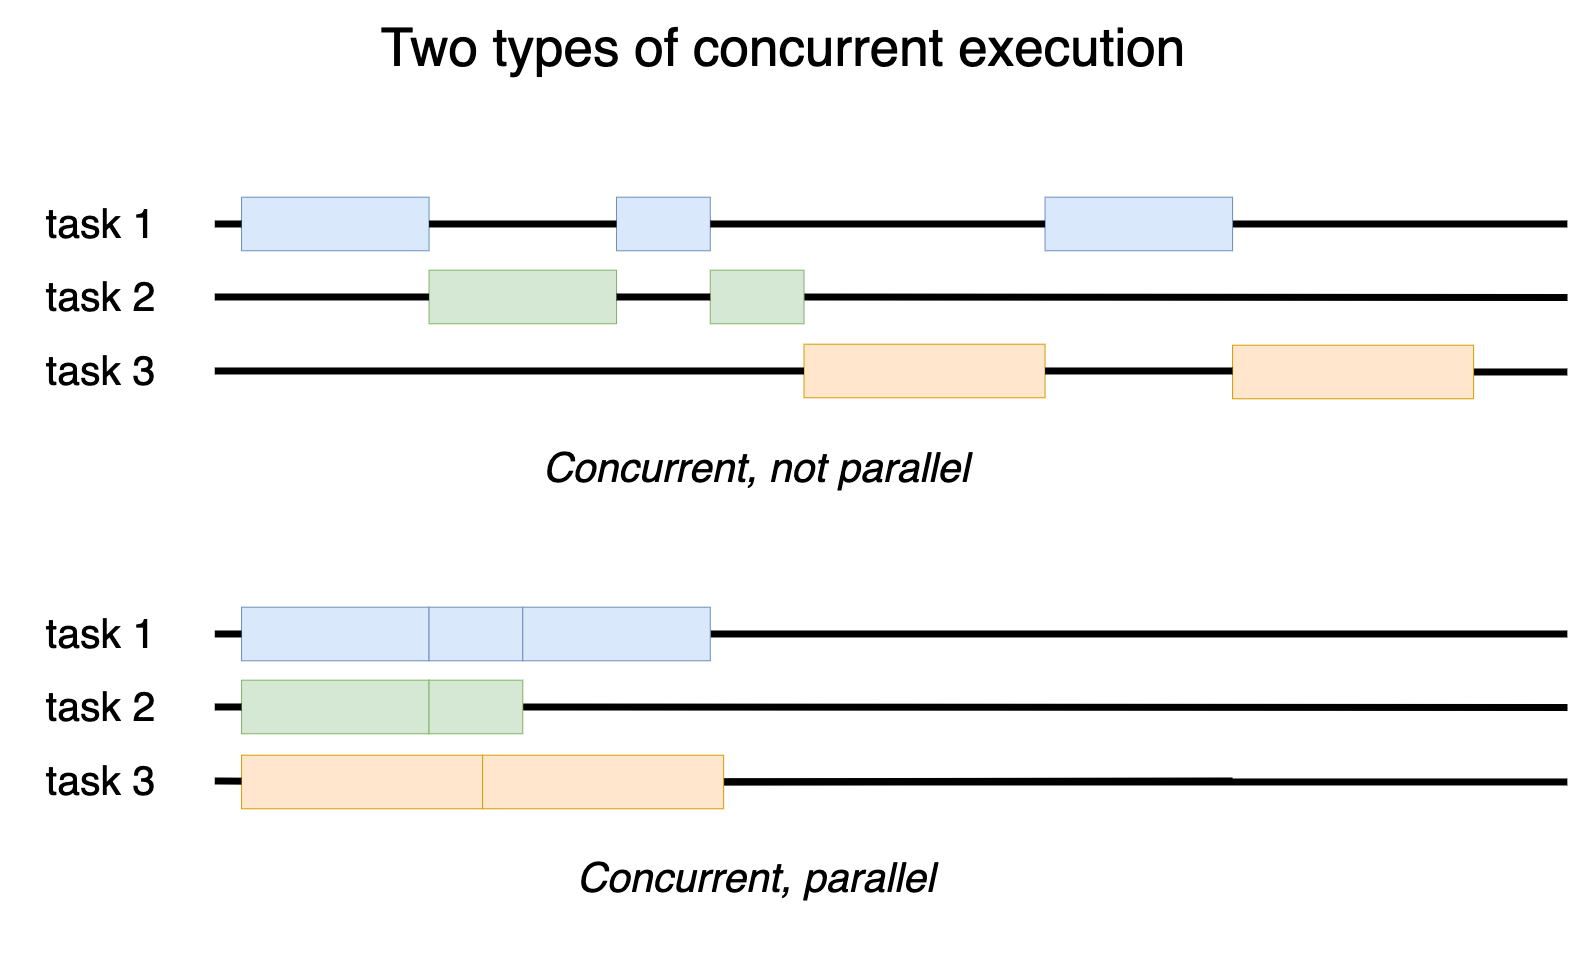
When it comes to pre-processing, we have several options: multiprocessing, multithreading, or coroutines. I won't insult your intelligence by throwing in a diagram explaining the difference between a process and a thread — I find those diagrams incomprehensible and only helpful for people who already understand the difference.
Since pre-processing can be computationally expensive, it’s clear that coroutines should be set aside: only one task can run at a time within the Python interpreter, meaning you can't fully leverage the hardware (i.e., only one CPU core would be used because coroutines are handled by a single process).
Multiprocessing is tempting, but it introduces other issues (data sharing, inability to share the CUDA context, etc.). This is the approach used by PyTorch's DataLoader. I won’t dive into that here because I want to keep things simple (and also to try out some different things 😇). Besides, I’m not sure PyTorch’s DataLoader is particularly suited for certain cases (like a web API, for example). If you're curious about PyTorch's DataLoader, I found this article particularly interesting.

Using threads for pre-processing requires some caution. Due to the GIL (Global Interpreter Lock), only one Python thread can execute Python code at a time. However, most libraries that rely on lower-level code (think C, C++, Rust, whatever) release the GIL when they run. This means those parts of the code can run in parallel across different threads (and therefore make use of the CPU’s multiple cores).
It's actually pretty easy to check. Take, for instance, image resizing with OpenCV (using cubic interpolation). We can set up a quick baseline with the following script (which uses a bit of async for image reading, just for fun). On my machine (i7-12700KF with DDR5), I hit around 100 FPS.
Now, let’s distribute the computation across multiple threads. Since OpenCV still interacts with the Python interpreter (as it’s just bindings to the underlying C++ library), each thread will still make a few calls to the GIL. So, we can expect some non-linear scaling. In an ideal scenario (without the GIL), we’d probably get close to 100 FPS per core (at least, on my machine).
To compare with code that doesn’t release the GIL at all (i.e., pure Python code), I’m using a simple loop (with 1.5 million iterations) that gives performance similar to OpenCV’s resizing function (around 100 FPS).
As expected, the performance doesn't scale linearly with the number of threads (likely due to the GIL). With a single thread, the performance is the same between the experiments with and without the GIL, as well as with our baseline using asynchronous code. This makes sense because the asynchronous part of the code is minimal compared to the computation.
We could probably improve the performance of the multi-threaded code by using Cython, for example, to completely get rid of the GIL (but we might save that for another time).
The data of the previous graph were generated using the following script.
Bonus
Previously, I made a few assumptions about the GIL. To verify them, I used NVIDIA Nsight Systems (2024.2).
In the case of our code using OpenCV, here’s what we observe with 8 threads. The GIL is indeed being used intermittently, but the different threads are still heavily utilized.

In the case of our code that heavily relies on the GIL (still with 8 threads), we observe that the threads are almost constantly waiting for the GIL, leading to significant underutilization of the CPU.

Conclusion
Unsurprisingly, the GIL has a significant impact on our applications, and it's something we need to account for, or for now, at least. Indeed, exciting things are on the horizon with PEP 703. If you want to know more about this, I would recommend the following presentation, which I found amazing.
Anyway, that was a first introduction to inference, focusing on pre-processing. Next time, we’ll cover some basics of CUDA. Maybe.