Fixing Kubernetes Load Balancing with HTTP/3

Kubernetes is a great technology. I use it at work, but also personally, through a lightweight distribution called k3s. It really simplifies application deployment and scaling.
Recently, I’ve had the opportunity to tinker quite a bit with HTTP APIs (mainly microservices embedding AI models). When the traffic is constant, the situation is straightforward : you have a fixed number of replicas for your application and everything works out perfectly.
However, traffic is rarely constant (especially in my job) and fluctuates throughout the day (sometimes unpredictably). In those cases, we generally use horizontal scaling (HPA) to add replicas and handle the load. Unfortunately, I noticed that new replicas were very often underutilized compared to existing ones. In reality, this behavior is completely normal once you dig a little into how Kubernetes and the TCP/IP stack work. Fair warning : we’re going to get into some networking here, and that’s not exactly my strongest suit.
When you expose an application in a Kubernetes cluster, you typically define 3 resources : a deployment, a service, and an ingress. The deployment manages a fleet of pods while the service (ClusterIP; I won’t cover other service types here) provides a single entry point for all pods. Kubernetes handles load balancing between pods. Naively, one might think that Kubernetes performs active load balancing between pods to distribute the load, but actually, not at all. Simple iptables rules route traffic to pods with equal probability (so it’s not even Round Robin), and that’s it. With the TCP protocol, we can then understand why this can be a problem. Once a connection is established, routing no longer takes place. The HTTP/1.1 specification allows reusing TCP connections to reduce latency, which explains the phenomenon we observe with our HTTP APIs. The same applies to HTTP/2, which also relies on TCP.
This article summarizes this behavior very well, and it also has some nice diagrams.

In reality, the problem doesn’t seem to arise if you use other technologies instead of iptables (like IPVS), but I haven’t looked into it much. This blog post is just an excuse to play around with Kubernetes and try to better understand what’s going on under the hood.
Illustrating the Problem
Rather than describe things at length, let me walk through some graphs. But first, let me introduce the setup I used.
Setup
I’ll use a very simple setup that should be fairly representative. The API uses FastAPI and Pydantic. It consists of a single route that returns the hostname of the machine. This will allow us to identify which pod served the request.
| |
It is served with Hypercorn, which supports HTTP/1.1, HTTP/2, and HTTP/3. To support HTTP/2 and HTTP/3, certificates are required. For our test, the certificates can be self-signed (and that’s clearly what I did). First, I created a local certificate authority with OpenSSL and used it to generate my certificates. The following article describes the process quite well.

To test the different protocols, I will use multiple ports. TCP port 5080 is used for HTTP/1.1 (without encryption). TCP port 5443 is used for HTTP/2, but it can also serve HTTP/1.1 if the client doesn’t support HTTP/2. The server also listens on UDP port 5443 to support HTTP/3. The server specifies the Alt-Svc header, which should allow the client to start an HTTP/3 connection after initiating a first TCP connection via HTTP/2 (though I’ll admit I never managed to get that feature working, but it’s not really a problem here).
worker_class = "trio"

bind = "0.0.0.0:5443"
quic_bind = "0.0.0.0:5443"
insecure_bind = "0.0.0.0:5080"
alt_svc_headers = ["h3=\":5443\"; ma=86400, h3-29=\":5443\"; ma=86400"]

ca_certs = "certs/ca.pem"
certfile = "certs/cert.crt"
keyfile = "certs/cert.key"

accesslog = "-"
errorlog = "-"

use_reloader = false
debug = false
Load Balancing
This application is deployed on my k3s cluster. For simplicity, I use a NodePort service to expose my application directly on a Kubernetes node (port 5080 to 30080 and 5443 to 30443). I just want to test the effect on load balancing, so there’s no need to bother with a reverse proxy like Traefik or nginx. A readiness probe is defined on my deployment to avoid routing traffic to an instance until it is ready. Resources are intentionally constrained to simulate heavy usage.
With 2 instances, we can see the expected behavior. Each instance absorbs approximately 50% of the traffic.
ben@localhost:~ $ curl -sq http://k3s:30080/ | jq
{
  "hostname": "app-5b7b768947-vg8nq"
}
ben@localhost:~ $ curl -sq http://k3s:30080/ | jq
{
  "hostname": "app-5b7b768947-vg8nq"
}
ben@localhost:~ $ curl -sq http://k3s:30080/ | jq
{
  "hostname": "app-5b7b768947-vg8nq"
}
ben@localhost:~ $ curl -sq http://k3s:30080/ | jq
{
  "hostname": "app-5b7b768947-27pk4"
}
ben@localhost:~ $ curl -sq http://k3s:30080/ | jq
{
  "hostname": "app-5b7b768947-27pk4"
}
ben@localhost:~ $ curl -sq http://k3s:30080/ | jq
{
  "hostname": "app-5b7b768947-27pk4"
}
ben@localhost:~ $ curl -sq http://k3s:30080/ | jq
{
  "hostname": "app-5b7b768947-vg8nq"
}
HTTP/1.1 Baseline
First, let’s establish a baseline to have a point of comparison. I’ll use Locust for my benchmarks. The definition is quite simple : it just reuses what Locust already provides.
| |
The goal is to try to saturate our application. I’ll simulate 1000 users (spread across 10 workers). To start, I only use a single replica of the application.
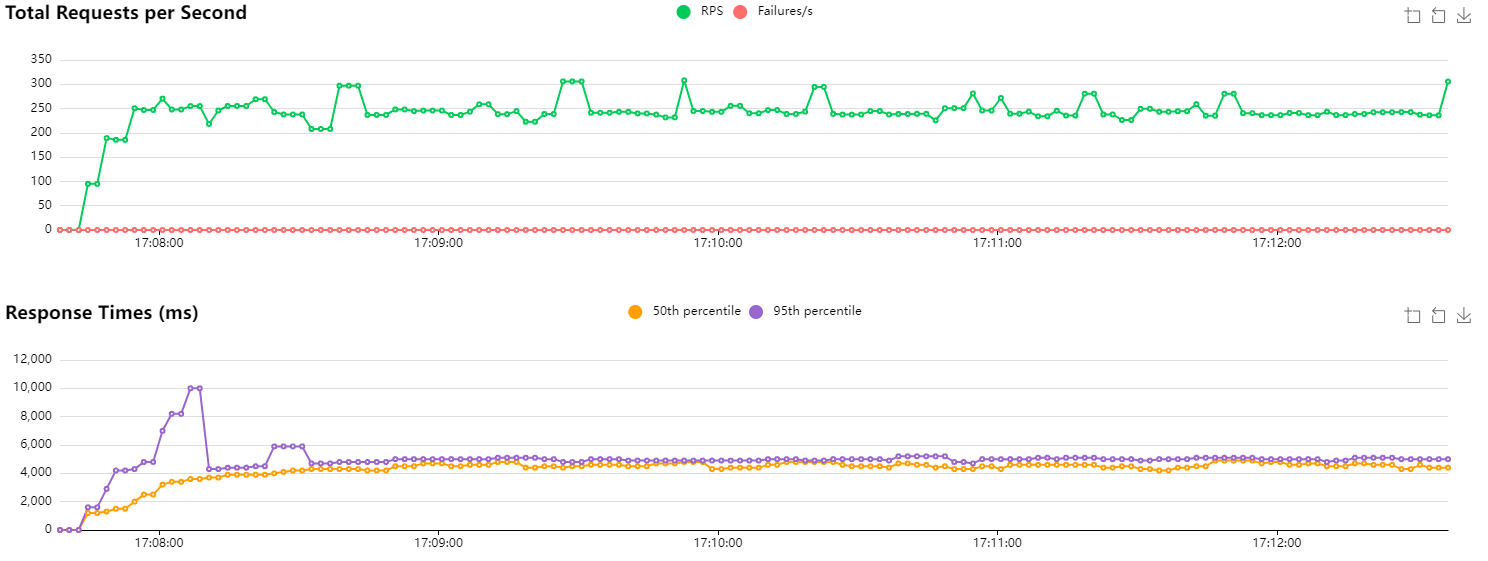
HTTP/1.1 baseline with 1 replica
The number of requests per second (RPS) is around 250. Since my machine’s CPU usage is fairly low, this suggests the API is overwhelmed and responding as fast as it can. Looking at the metrics for the replica, Kubernetes reports that its CPU allocation is at 100%. Great. We also notice that latencies are quite high (expected to be around 1000–1100 ms if everything were fine), which corroborates a server that is struggling to respond.
Next, I re-run the same benchmark but with two instances this time. Logically, I expect to be able to handle twice as many requests per second.
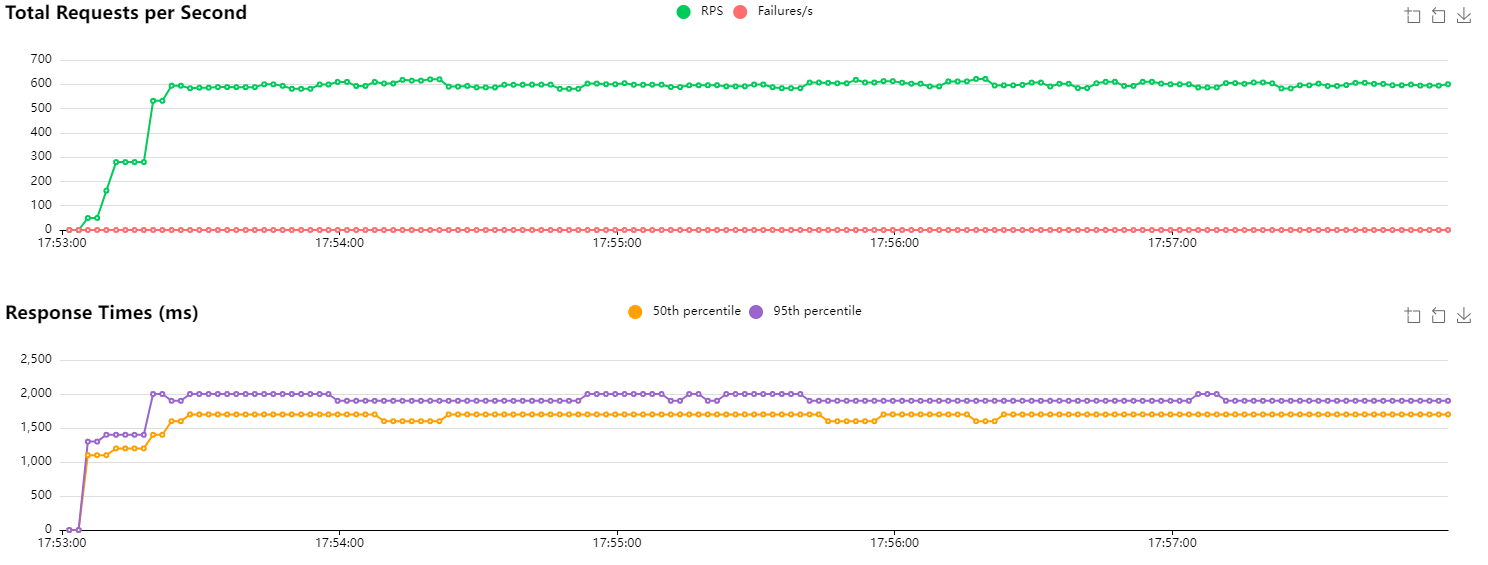
HTTP/1.1 baseline with 2 instances
Performance is even slightly better than I hoped. We’re handling around 600 RPS, and latencies are greatly improved (median at 1700 ms vs. 4200 ms previously). I imagine the network plays a role in our results. The order of magnitude is still consistent.
Now, I’ll re-run the same test on a single instance, and scale up the number of instances after 2 minutes.
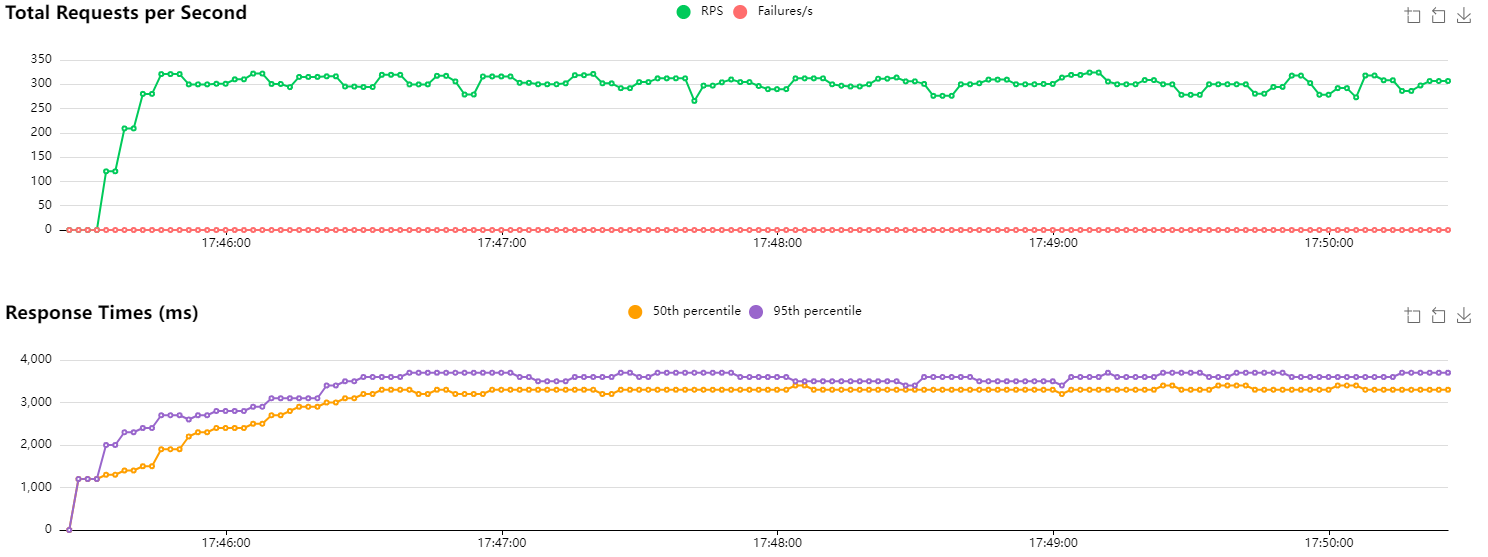
HTTP/1.1 with scaling after 2 minutes
Unsurprisingly, we observe no change (even though performance is slightly better than our first test). Looking more closely at the logs of the new instance, this is confirmed. Traffic is simply not routed to that instance because connections are being reused. The only requests we observe are those from the readiness probe. Kubernetes reports CPU usage at 0%.
[2024-10-19 15:47:34 +0000] [8] [INFO] Running on https://0.0.0.0:5443 (CTRL + C to quit)
[2024-10-19 15:47:34 +0000] [8] [INFO] Running on http://0.0.0.0:5080 (CTRL + C to quit)
[2024-10-19 15:47:35 +0000] [8] [INFO] Running on https://0.0.0.0:5443 (QUIC) (CTRL + C to quit)
[2024-10-19 15:47:36 +0000] [8] [INFO] 10.42.0.1:56096 - - [19/Oct/2024:15:47:36 +0000] "GET / 1.1" - - "-" "kube-probe/1.31"
[2024-10-19 15:47:36 +0000] [8] [INFO] 10.42.0.1:56096 - - [19/Oct/2024:15:47:36 +0000] "GET / 1.1" 200 37 "-" "kube-probe/1.31"
[2024-10-19 15:47:37 +0000] [8] [INFO] 10.42.0.1:56106 - - [19/Oct/2024:15:47:37 +0000] "GET / 1.1" - - "-" "kube-probe/1.31"
[2024-10-19 15:47:37 +0000] [8] [INFO] 10.42.0.1:56106 - - [19/Oct/2024:15:47:37 +0000] "GET / 1.1" 200 37 "-" "kube-probe/1.31"
[2024-10-19 15:47:42 +0000] [8] [INFO] 10.42.0.1:33752 - - [19/Oct/2024:15:47:42 +0000] "GET / 1.1" - - "-" "kube-probe/1.31"
[2024-10-19 15:47:42 +0000] [8] [INFO] 10.42.0.1:33752 - - [19/Oct/2024:15:47:42 +0000] "GET / 1.1" 200 37 "-" "kube-probe/1.31"
[2024-10-19 15:47:47 +0000] [8] [INFO] 10.42.0.1:33764 - - [19/Oct/2024:15:47:47 +0000] "GET / 1.1" - - "-" "kube-probe/1.31"
[2024-10-19 15:47:47 +0000] [8] [INFO] 10.42.0.1:33764 - - [19/Oct/2024:15:47:47 +0000] "GET / 1.1" 200 37 "-" "kube-probe/1.31"
[2024-10-19 15:47:52 +0000] [8] [INFO] 10.42.0.1:33350 - - [19/Oct/2024:15:47:52 +0000] "GET / 1.1" - - "-" "kube-probe/1.31"
[2024-10-19 15:47:52 +0000] [8] [INFO] 10.42.0.1:33350 - - [19/Oct/2024:15:47:52 +0000] "GET / 1.1" 200 37 "-" "kube-probe/1.31"
[2024-10-19 15:47:57 +0000] [8] [INFO] 10.42.0.1:33360 - - [19/Oct/2024:15:47:57 +0000] "GET / 1.1" - - "-" "kube-probe/1.31"
[2024-10-19 15:47:57 +0000] [8] [INFO] 10.42.0.1:33360 - - [19/Oct/2024:15:47:57 +0000] "GET / 1.1" 200 37 "-" "kube-probe/1.31"
In short, we’re wasting resources because the new instance is simply not being used (which doesn’t improve the situation at all).
A Solution?
So where does that leave us? Not completely stuck, but there’s no perfect answer either.
We could consider setting up active load balancing. It would consume resources, but it would ensure the load is distributed. As far as I know, this can be done with an nginx or HAProxy instance (though I’m not sure how it would behave for traffic types that don’t rely on TCP, like HTTP/3…). I haven’t really looked into how to set that up (and I mostly just wanted to try HTTP/3 anyway, haha).
Another solution would be to use IPVS instead of iptables, but that’s a bit outside my area of expertise.
We could perhaps tinker with the readiness probe to prevent traffic from being routed to an instance if latency climbs too high, but I doubt it would have any impact on already-open connections (which is our main problem here).
I have two other ideas to explore, one of which I already know is a bad idea, but I’m curious about its effect.
HTTP/1.1 Close Connection
If the problem is related to TCP connections staying open, well, the solution is to close those TCP connections. It’s silly, but it works. However, it severely degrades performance.
By default, the Locust client (like most HTTP clients) uses a connection pool and reuses connections across HTTP requests. This saves time by avoiding repeated TCP handshakes (or even TLS handshakes if traffic is also encrypted). Fortunately, HTTP/1.1 provides a header to enable or disable this mechanism : Connection: close. Locust’s documentation also shows us how to close the connection manually.
| |
In the same way, I run the script with identical parameters and scale my application after 2 minutes.
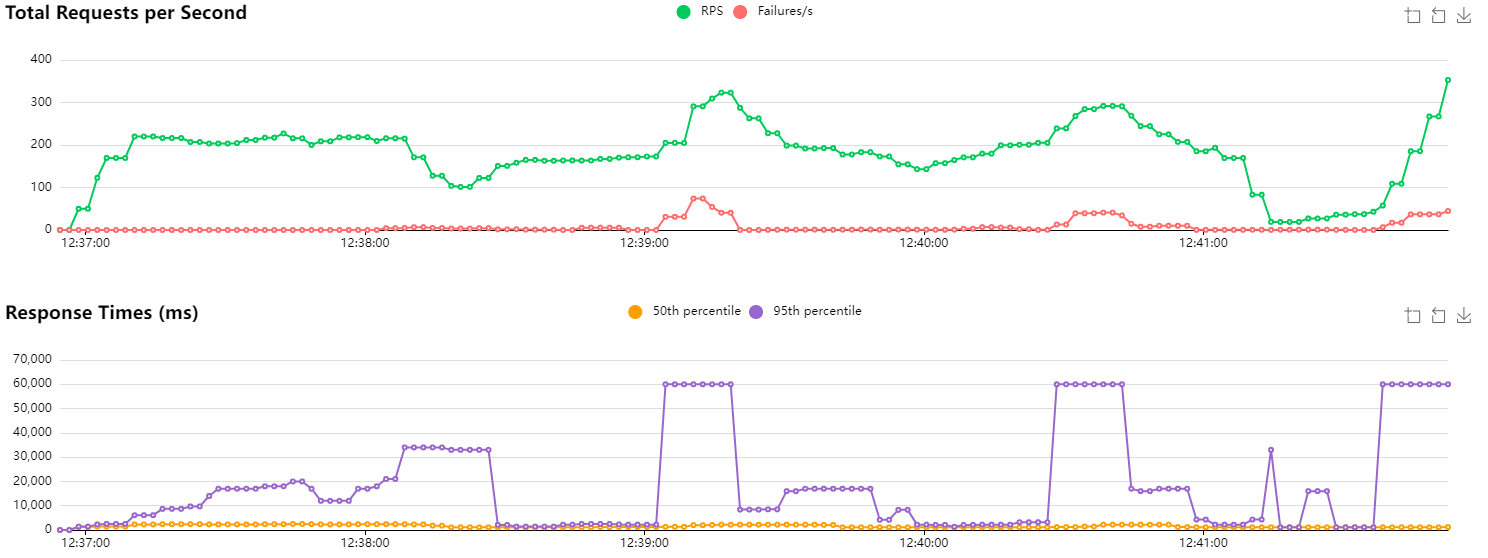
HTTP/1.1 with new connections and scaling after 2 minutes
Initially, I report CPU usage of around 95% on the single instance. Once the deployment scales, both instances are used at roughly 50% (though it’s actually quite variable). Since we’re closing the connection after each request, I assume we’re doing more I/O and therefore the CPU works less.
Overall, the RPS count is lower and less stable. Latencies are higher. I didn’t run this test at the same time as the previous ones, so that may have a slight influence. We had already observed differences of ±50 RPS in our baseline.
A few errors can be observed when scaling occurs. My readiness probe may not be correctly configured, as traffic is being routed to the new instance before it is apparently ready.
HTTP/3
The other idea I had in mind is to use HTTP/3 internally. Since the protocol relies on QUIC which uses UDP, the notion of a connection doesn’t apply in the same way (at least not for UDP). Packets will therefore be routed with equal probability across replicas. Since QUIC uses an ID to identify packets belonging to the same data “stream” (along with other mechanisms to ensure nothing is lost), we can hope that all packets will be correctly routed to the right instance, but that the next request will possibly be handled by a different replica.
At the moment, doing HTTP/3 with Python is a bit of a pain. Locust doesn’t support HTTP/3, and most libraries are asynchronous (which is great), but they don’t integrate very well with Locust which uses gevent. I therefore had to write a custom Locust User for HTTP/3. It’s probably a bit shaky, but it seems to work. It uses the niquests library. Since we’re just tinkering here, I’m disabling all certificate verification (bad practice, don’t do this in production).
| |
Similarly, I run my benchmark with the same parameters and scale to 2 instances after 2 minutes.
After scaling, both instances were receiving traffic, confirming that UDP-based routing does distribute load across replicas as expected. Performance-wise, it’s difficult to draw firm conclusions : results were noisy enough that it’s hard to tell how much came from the implementation and how much is inherent to UDP. It’s also worth noting that we’re not using HTTP/3 to its full potential here, as features like multiplexing are left on the table.
Conclusion
This was a purely exploratory exercise and definitely not something I’d recommend for production, especially given the complexity of managing internal certificates (though tools like cert-manager could make that more manageable).
That said, it’s genuinely interesting to see that HTTP/3 does solve the load balancing problem we set out to investigate. I also haven’t explored the option of placing a reverse proxy in front that would accept HTTP/1.1 or HTTP/2 traffic and forward it as HTTP/3 on the backend, which could be a cleaner real-world approach.
For now, it’s probably best to wait for the ecosystem to mature a bit more.